|
Scientific Paper / Artículo Científico |
|
|
|
|
https://doi.org/10.17163/ings.n32.2024.03 |
|
|
|
pISSN: 1390-650X / eISSN: 1390-860X |
|
|
LOS VEHÍCULOS ELÉCTRICOS Y SU IMPACTO EN EL SISTEMA ELÉCTRICO DE DISTRIBUCIÓN: CASO DE ESTUDIO “ALIMENTADOR URBANO DE LA CIUDAD DE PORTOVIEJO” |
||
|
ELECTRIC VEHICLES
AND THEIR IMPACT ON THE ELECTRIC DISTRIBUTION SYSTEM: A CASE STUDY OF THE
URBAN FEEDER IN PORTOVIEJO |
||
|
Arturo Zavala-Tubay1,* |
|
Received: 16-06-2023, Received after review: 05-04-2024, Accepted:
30-04-2024, Published: 01-07-2024 |
|
Abstract |
Resumen |
|
In Portoviejo, the
current use of electric vehicles (EVs) is limited compared to conventional
vehicles. However, due to the implementation of laws, regulations, and
policies promoting electric mobility in Ecuador, a significant increase in
the integration of EVs into the city's electrical system is anticipated in
the coming years. To anticipate the impact on the electrical infrastructure,
a simulation is conducted using CYMDIST software on an electrical
distribution feeder operated by the Public Company Corporación
Nacional de Electricidad (CNEL EP), Manabí Business
Unit (Portoviejo). The simulation considers three scenarios projected for
2030: 1. Baseline scenario without EV integration, 2. Unrestrained EV
integration, and 3. Managed EV integration. This research aims to simulate
the integration of up to 230 EVs into the network to provide benchmark data
for understanding the potential impacts on the feeder as EV adoption
increases, with vehicles being charged over extended periods. The
investigation will highlight the importance of demand management with EV integration, demonstratingsignificant
effects on the demand curve, voltage profile, and total harmonic distortion
rate (THD%) of a 13.8 kV distribution feeder. |
En la ciudad de Portoviejo, actualmente el uso de vehículos eléctricos (VE) es limitado en comparación con el uso de los convencionales. Sin embargo, debido a la implementación de leyes, reglamentos y regulaciones que impulsan la movilidad eléctrica en el Ecuador, se espera que en los próximos años se produzca un ingreso considerable de esta carga (VE) en el sistema eléctrico de la ciudad. En este sentido, para determinar probables afectaciones a producirse en el sistema eléctrico en el futuro, se realiza la simulación en el software CYMDIST de un alimentador de distribución eléctrico de la Empresa Pública Corporación Nacional de Electricidad CNEL EP Unidad de Negocio Manabí (Portoviejo), considerando tres escenarios de análisis proyectados al año 2030 como son: 1. Caso base sin ingreso de VE, 2. Ingreso no controlado de VE y 3. Ingreso controlado de VE. El presente trabajo simula el ingreso de hasta 230 vehículos en la red, puesto que, el objetivo del estudio es tomar datos referenciales para conocer la posible afectación en el alimentador cuando los VE se conecten de forma masiva y se carguen prolongadamente. Al final del estudio se comprobará la importancia de la gestión de la demanda cuando se produzca el ingreso de vehículos eléctricos, el cual refleja resultados importantes en la curva de demanda, perfil de voltaje y tasa de distorsión armónica THD % de un alimentador de distribución a 13,8 kV.
|
|
Keywords: EV, Electric Vehicle, Harmonics,
Technical Losses, Electrical Planning, CYMDIST, Distribution, CNEL |
Palabras clave: VE, vehículo eléctrico, armónicos, pérdidas técnicas, planificación eléctrica, CYMDIST, distribución, CNEL |
|
1,*Departamento de Planificación, Corporación Nacional de Electricidad (CNEL EP UN MAN), Ecuador. Corresponding
author ✉: arturo.zavala@cnel.gob.ec . 2Facultad de Ciencias Matemáticas, Físicas y Químicas, Universidad Técnica de Manabí, Ecuador.
Suggested
citation: Zavala-Tubay, A.; Pico-Mera, H. and Pico-Mera, G. “Electric
Vehicles and Their Impact on the Electric Distribution System: A Case Study
of the Urban Feeder in Portoviejo,” Ingenius, Revista de Ciencia y Tecnología, N.◦ 32, pp. 27-35, 2024, doi: https://doi.org/10.17163/ings.n32.2024.03. |
|
1.
Introduction The global
commitment to significantly reduce carbon emissions in the short term has
driven the development of environmentally sustainable technologies, such as
electric vehicles (EVs) [1]. Consequently, in recent years, the adoption of
this technology has spread worldwide in response to the urgent need to reduce
environmental pollutant emissions [2]. Considering that the
use of electric vehicles contributes to environmental conservation, it is
necessary to analyze the impact that charging this new technology may have on
electrical distribution networks. According to [3] and [4], since these loads
are modeled and behave as nonlinear, they could have a considerable negative
impact on power quality (including voltage, imbalance levels, and harmonics),
altering these electrical parameters under different load conditions. Moreover, it is
anticipated that the uncontrolled increase in loads due to the integration of
EVs will directly impact the electrical infrastructure of the distribution
company, owing to the potential rise in demand [5]. Electric vehicles
(EVs) are characterized by the use of an electric
traction motor for vehicle propulsion [6]. The energy required to drive this
motor is stored in batteries, which are typically charged from an external
power source [7]. Typically, EVs use
lithium-ion batteries due to their advantages over other technologies,
including higher efficiency, low maintenance costs, and lightweight
properties. These characteristics make them particularly attractive for use
in electric vehicles [8]. While batteries are
considered the primary energy source for EVs, this study will focus on the
impact these devices will have on electrical networks rather than on the
batteries themselves. The introduction of
electric vehicles into the market will result in significant variations in
energy and power demand [9]. This will impact electrical networks, presenting
a major challenge for distribution companies. They must ensure the continuity
of service to their customers while accommodating the increasing power and
energy demand. Anastasiadis et al.
[10] emphasize the necessity of anticipating suitable solutions to potential
issues within the electrical system. As the popularity of electric traction
vehicles continues to grow, the increased demand significantly impacts the
network. Negative effects
include impacts on voltage profiles, saturation of electrical system
components, voltage imbalances, harmonic distortion, and increased technical
energy losses. |
Conversely, positive effects
encompass improved energy management techniques, commonly referred to as
demand management strategies [11]. To determine the
impact of integrating electric vehicles (EVs) into the system, it is
essential to analyze various involved variables. These include network
demand, electrical system loadability, load
profiles of different customer types, and thecharacteristics
of electric vehicles [12]. The impact on the
network is closely linked to the type of charging applied to electric
vehicles. According to [13], charging can be classified into three levels:
Level 1 (slow charging), Level 2 (semi-fast charging), and Level 3 (fast
charging at charging stations). The type of charging corresponds to the
battery charging speed. Levels 2 and 3 are typically used in public and
private settings, while Level 1 is primarily designated for domestic or
garage charging. Table 1 presents the
classification of battery recharge types according to EV characteristics
[14]. Table 1. Battery charging levels for
EVs
The fast charging process can be completed in approximately 30
minutes, allowing the battery to reach 80% of its nominal capacity [15]. Although the impact
of EVs on the grid is directly related to the charging performed (slow,
semi-fast, or fast), the current analysis will focus solely on slow charging.
This type of charging is expected to be prevalent in residential settings
among consumers or clients of electric distribution companies. Due to the
challenges posed by the nonlinear loads of electric vehicles, it is essential
to conduct a study to estimate their impact on the grid. This research will
analyze the effects of electric vehicle charging on the demand curve of a
feeder, as well as the impact on voltage profiles, harmonics, and practical
technical losses. This study will be
conducted through a simulation using CYMDIST software, based on a real feeder
from the electrical distribution system of Corporación
Nacional de Electricidad CNEL EP, Manabí Business
Unit, projected up to 2030. The program modules will encompass load
distribution, load flow, harmonics, and long-term dynamics. |

|
Data derived from
readings of the electrical system under analysis will be utilized for the
network simulation. An urban feeder from Portoviejo, Manabí, has been
selected for this study. The electric vehicle load, designed for simulation
in the CYMDIST software, will be modeled as an unbalanced multifrequency
current source. The data for this modeling will be obtained from readings
taken while charging electric vehicle batteries using type I (slow) charging,
with measurement intervals of 10 minutes. This study explores
simulated scenarios involving the integration of 160 and 230 electric
vehicles into the electrical grid. These figures are referential and can be adjustedaccording to the projected EV integration
estimates published in Panorama Eléctrico magazine
[16]. Considering that
electric vehicles (EVs) contribute to various quality issues within the
distribution network, notably voltage imbalance, alterations to voltage
profiles, electrical infrastructure saturation, and deviations from nominal
frequency [17], this article presents real-world data collected during the low-voltage charging process of an electric vehicle. In Ecuador, the
Energy and Non-Renewable Natural Resources Regulation and Control Agency
(ARCERNNR) oversees the strategic sectors of electricity, hydrocarbons, and
mines. This agency establishes directives and guidelines for the Electric
Energy Distribution Company through corresponding regulations. Specifically,
Resolution No. ARCERNNR 017/2020 enacts Regulation No. ARCERNNR 002/20
"Quality of Distribution and Commercialization of Electric Energy
Service" [18], which comprehensively addresses product quality in its
second chapter. The referenced
regulation delineates the permissible ranges for electrical variables, which
are commonly influenced by integrating electric vehicles into the networks,
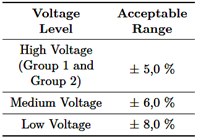
as detailed below: 1.1.Product
Quality 1.1.1. Voltage Level Table 2 displays the voltage
ranges mandated by the regulatory authority ARCERNNR for distribution
companies in Ecuador, as stipulated by the regulation [18]. For this research,
the values corresponding to medium voltage will be examined, and compliance
with the regulations will be assessed, as outlined in Table 2. |
Table 2. Acceptable Voltage Level Ranges
1.1.2.
Harmonic
Distortion of Voltage The individual harmonic distortion
factor of voltage (%) and the total harmonic distortion factor of voltage
(THD %) adhere to the ranges specified in ARCERNNR Regulation 002-20, as
detailed in Table 3. The analysis will reference values corresponding to both
medium and low voltage levels. Table 3. Maximum Voltage
Harmonic Limits (% of nominal voltage)
2.
Materials and
Methods This research aims to establish a
foundational baseline for subsequent demand studies to be undertaken by the
Strategic Public Company Corporación Nacional de Electricidad CNEL EP, Manabí Business Unit, concerning
electromobility. This initiative will equip the distribution company with an
enhanced tool for longterm planning of the
electrical system, considering the potential impacts of electric vehicle
integration across various load scenarios. To analyze the
impact on the electrical grid, this study references a case in which a
specific number of electric vehicles (EVs) were randomly integrated into the
system. Their incorporation was simulated using CYMDIST software, an advanced
engineering tool for electrical planning, operation, and optimization studies
[19]. |

|
The materials
employed for the simulation are outlined as follows: ·
Georeferenced
electrical network, considering loads according to user type. ·
Primary measurements
or readings fromthe existing 13.8 kV feeder. ·
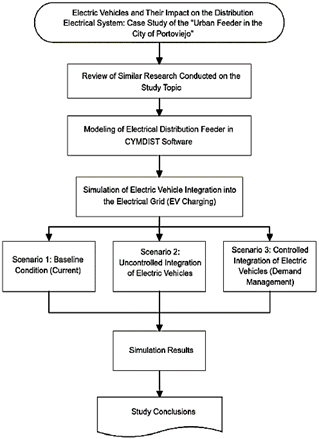
Measurements or readingsconducted on an electric vehicle by CNEL EP. 2.1.Methodology The methodology employed aligns
with the diagram depicted in Figure 1.
Figure 1. Flowchart of the Methodology Applied in the Study 2.1.1. Determination of Scenarios To elucidate the impact on the
electrical grid stemming from the integration of electric vehicle (EV)
charging, three simulation scenarios projected up to the year 2030 have been
delineated. These scenarios aim to assess the influence of EVs on various
parameters, including demand, voltage drop, harmonics, and technical losses. A. Scenario 1: Baseline Scenario,
Feeder Projected to 2030. The operational dynamics of the feeder under study are meticulously analyzed. For the |
projection to the year 2030, a vegetative annual growth rate of 3.5%
for the feeder is considered. EV charging is not included in this scenario. B. Scenario 2: Unrestricted EV
Charging (Year 2030). In this scenario, the projected situation is analyzed by simulating
that EVs will be charged when their owners return home after work.
Consequently, vehicle charging is expected to start shortly after 6:00 PM. C. Scenario 3: Controlled EV Charging
(Year 2030). This
scenario anticipates the year 2030, analyzing electric vehicle (EV) charging initiation post- 10:00 PM to prevent
its peak from coinciding with the system’s maximum demand period. It also
explores strategic demand management approaches, including the staggered
charging of vehicles at times that do not overlap with peak demand. This
involves implementing public policies to facilitate EV charging management.
One such strategy is developing charging infrastructure in public and private
parking areas at workplaces, enabling vehicles to charge throughout the day
and thus mitigating peak demand impacts [20]. The aim is to model a
controlled charging environment for residential and commercial users. EVs are
progressively connected to the distribution grid post-workday, with charging
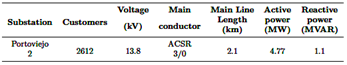
activities extending overnight into the early morning. 2.1.2.
Information on
the Feeder under Study The feeder chosen for this study
is part of the electrical distribution system of Portoviejo, located in the
province of Manabí. According to the projection for the year 2030, the
pertinent data for this feeder are detailed in Table 4. Table 4. Characteristics of the Feeder
As delineated in
Table 4, the network comprises 2.10 km of ACSR 3/0 conductor along the main
line. The base voltage is 13.8 kV, the projected active power load is 4.77
MW, and the reactive power load is 1.10 MVAR. The network serves a total of
2612 customers, including 954 residential users. |
|
3.
Results and
discussion This section presents the results
of the scenarios described in section 2.1.1, which were simulated using
CYMDIST software: -
Scenario 1: Baseline
scenario, feeder projected to 2030. -
Scenario 2:
Unrestricted EV charging (year 2030). -
Scenario 3:
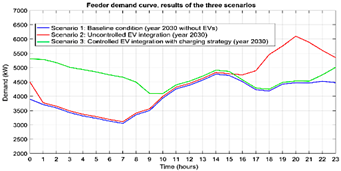
Controlled EV charging (year 2030). 3.1.Demand Figure 2 illustrates the results
of the three scenarios analyzed for 2030, comparing the impact of electric
vehicles on demand within the simulated electrical system.
Figure 2. Demand Curve,
Results Obtained in the Three Analyzed Scenarios (Consolidated) According to Figure
2, Scenario 2, which features uncontrolled EV charging, exhibits a peak
demand of approximately 6.1 MW. In contrast, Scenario 3, which implements
controlled EV charging with demand management strategies, records a peak
demand ofapproximately 4.5 MW during the same
demand period. This result
underscores the positive impact of implementing demand management mechanisms
on the feeder, significantly reducing peak loads during periods of maximum
demand. Consequently, this enhances the network’s efficiency and increases
the feeder’s available transport capacity. This result aligns
with the findings documented in [3], which assert that an uncontrolled
charging strategy represents the worst scenariofor
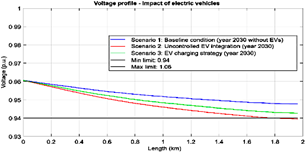
demand control and distribution network imbalances. 3.2.Voltage Drop 3.2.1. Voltage Profile Figure 3 displays the voltage
profile results for the simulated feeder for 2030, illustrating its behavior
across the three proposed scenarios. |
The detailed results
depicted in Figure 3 elucidate the positive impact of employing demand
management techniques in the EV charging process. Specifically, the voltage
level along the simulated feeder in Scenario 3, which incorporates EV
charging with load management strategies, is comparatively higher than that
observed in Scenario 2, where EV charging is uncontrolled. As illustrated in
Figure 3, it is noteworthy that the implementation of charging strategies
plays a crucial role in adhering to the ARCERNNR 002-20 regulations
concerning the acceptable voltage range in the feeder, which is established
at ±6%. This result aligns
with the findings of Lascano et al. [21], who report that integrating each
electric vehicle (EV) leads to a progressive voltage drop, resulting in
values that eventually exceed the limits prescribed by the referenced
regulations.
Figure 3. Voltage Profile,
Results Obtained in the Three Analyzed Scenarios (Consolidated) 3.2.2. Voltage at the Farthest Node of
the Feeder Figure 4 illustrates the voltage
behavior at the most distant node of the feeder across the three scenarios
proposed in this study. As detailed in Section 3.2.1, the figure demonstrates
that voltage levels at the farthest point of the feeder are higher when a
demand management system for EV charging is implemented.
Figure 4. Voltage Profiles
at the Farthest Node, Results in Three
Scenarios From Figure 4, it is evident that the voltage at the farthest point will be affected by the integration of EVs if strategies to mitigate this impact are not implemented. This result aligns with the findings of [21]. |

|
3.3.Total
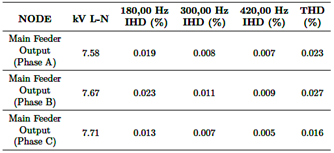
Harmonic Distortion Rate (THD %) Table 5 presents the projected
total harmonic distortion factor of voltage (THD %) for the year 2030,
reflecting the impact of integrating 230 electric vehicles into the simulated
feeder. Table 5. Total Harmonic
Distortion of Voltage in Medium Voltage (THD %)
As depicted in Table
5, the integration of electric vehicle (EV) loads, as simulated in the study,
ensures that the total harmonic distortion of voltage (THD%) remains within
the 5% threshold established by the ARCERNNR 002-20 regulation for medium
voltage. For simulation
purposes, EV loads were gradually introduced using CYMDIST software. Even
when the number of connected EVs reached 230, no significant levels of
harmonic distortion were observed at medium voltage. Consequently, it is
anticipated that the total harmonic distortion percentage (THD%) at this
voltage level will not be substantially impacted when slow-charging EVs (Type
I) are charged with the simulated number of EVs. On the other hand,
readings obtained using a power quality analyzer during the electric vehicle
(EV) charging process at low voltage levels indicate that the total harmonic
distortion of voltage (THD%) remains within limits prescribed by the ARCERNNR
002-20 regulation. However, there is a notable presence of the third and
fifth current harmonics, suggesting that the total harmonic distortion of
current includes significant values that must beconsidered
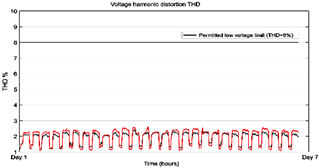
when multiple EVs are connected to the same circuit. Figures 5, 6, and 7
depict the curves for the total harmonic distortion of voltage (THD%) at low
voltage and those for the third and fifth harmonics, respectively, at the
same voltage level (real data measured at low voltage). The data depicted in
Figure 5 indicate that the harmonic distortion rate during the low-voltage charging process of an electric vehicle
remains within the parameters set forth by current quality regulations. |
Figure 5. Total Harmonic
Distortion of Voltage THD % Curve (Real Data from EV Charging Readings at Low
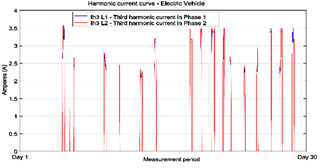
Voltage) Figure 6 presents
the third harmonic current for phases 1 (IhL1) and 2 (IhL2). When correlated
with the data in Figure 5, these currents fall within the permissible values
specified by current regulations. Notably, the harmonics illustrated in
Figure 6 were observed exclusivelyduring the EV
charging process.
Figure 6. Third Harmonic
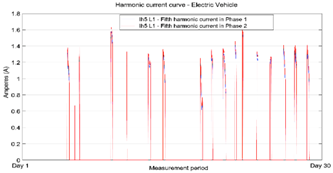
Current Curve (Measured in EV, Low Voltage) Figure 7 illustrates
the fifth harmonic currents for phases 1 (IhL1) and 2 (IhL2). When compared
with the data in Figure 5, these currents remain within the values allowed by
current regulations for this parameter.
Figure
7. Fifth Harmonic Current Curve (Measured in EV, Low
Voltage) |
|
It is important to
note that, despite the significant contributions of harmonics at low voltage
(specifically, the third and fifth harmonic currents) during electric vehicle
(EV) charging, these levels do not exceed the limits established by the
ARCERNNR 002-20 regulation. However, these values will probably increase with
the number of connected chargers. Consequently, the electric distribution
utility should consider implementing preventive measures as necessary. The case presented
in this section aligns with the findings of [3], where the authors indicate
that an increase in EV load can lead to harmonic distortion issues due to the
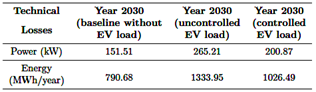
heightened injection of the third harmonic. 3.4.Technical
Losses Table 6 presents the projected
contribution of technical losses in power and energy for 2030, with detailed
identification according to the analyzed scenario. The final projection for
2030 includes the integration of 230 electric vehicles. Table 6. Projected Technical Losses for the Year 2030
As indicated in
Table 6, integrating electric vehicles into the grid will substantially
increase the system’s technical power and energy losses. Specifically, when
comparing the baseline scenario (Scenario 1, projected for 2030 without EVs)
to the scenario where EVs are charged uncontrollably (Scenario 2), technical
losses increase by 113 kW. In contrast, if EVs are charged using demand
management strategies (Scenario 3), the increase in technical losses is
limited to 49.36 kW compared to the baseline scenario. These results
demonstrate the positive impact of implementing demand management methods to
reduce operational losses within the system. 4.
Conclusions This study has successfully
established a baseline that will inform future demand studies conducted by
the Strategic Public Company Corporación Nacional
de Electricidad CNEL EP, Manabí Business Unit,
focusing on electromobility. |
The analysis has
confirmed the effects on a feeder’s demand curve due to controlled and
uncontrolled electric vehicle (EV) charging. In scenarios where residential
EV charging is concentrated at a specific hour of the day (uncontrolled
charging), demand can increase by up to 1 MW for every 160 vehicles.
Conversely, when EVs are charged in a controlled manner, the demand increase
is estimated to be around 0.1 MW for the same number of electric vehicles
connected to the grid. Based on the cases
studied, it is clear that the controlled scenario is
the most suitable for implementing EV charging within a distribution feeder.
Although voltage drops are inherent to the load characteristics in this
scenario, they are considerably less severe compared to the uncontrolled
charging scenario. In the latter, there is a significant deterioration in the
voltage profile, potentially degrading to levels below those permitted by the
quality regulations cited in this document. Incorporating EV
charging introduces an additional load on the electrical system. To mitigate
the risk of high demand peaks that could lead to grid instability, component
overloading, and reduced lifespan of infrastructure, it is advisable to
manage this load through effective electric demand management mechanisms. The implementation of
electric demand management mechanisms to regulate EV charging (controlled
demand) has effectively flattened the feeder’s demand curve by reducing peak
demands. This strategic control enhances the network’s efficiency and,
consequently, increases the available transport capacity within the feeder.
In the cases examined, this approach resulted in a favorable reduction of 1.6
MW in peak demand when comparing Scenario 2 with Scenario 3 during the same
demand period. An additional positive
impact on the system is the enhancement of voltage levels along the feeder,
as evidenced by the improved voltage profile. This observation confirms that
the voltage level at the most distant point of the feeder remains elevated
when EV charging is controlled. With the integration
of an average of 230 electric vehicles utilizing Type I charging, the
harmonic distortion rate does not compromise compliance with the Total
Harmonic Distortion (THD%) standards for |
|
medium voltage in the analyzed
feeder. Specifically, the feeder exhibits an approximate average harmonic
distortion rate of 0.02% at its output. However, it is essential to note that
the harmonic distortion rate (THD) may escalate with the increase in
connected chargers, necessitating careful monitoring and management to
maintain regulatory compliance and system integrity. Data collected from
an electric vehicle have shown that at low voltage, the third and fifth
current harmonics make significant contributions. This finding indicates that
the total harmonic distortion of current encompasses considerable values,
which should be carefully considered by the distribution company. The gradual
integration of electric vehicles (EVs) into the electrical distribution
system will considerably increase technical power losses. Specifically, for
the feeder under study, technical losses may increase by approximately 113 kW
when EV charging is uncontrolled. In contrast, adopting demand management
methods and controlled EV charging can significantly mitigate these losses,
limiting the increase to just 49.36 kW. References
[1] H. Pico, I. P. no, and B. Ponce, “Análisis de los factores que intervienen en el envejecimiento prematuro de las baterías de ion-litio mediante modelo teórico validado en laboratorio,” Revista Técnica Energía, vol. 17, no. 2, pp. 83–91, 2021. [Online]. Available: https://doi.org/10.37116/revistaenergia.v17.n2.2021.432 [2] CEPAL, Propuesta de marco regulatorio para acelerar la inversión en electromovilidad mediante la reconversión de vehículos que usan combustibles fósiles. Comisión Económica para América Latina y el Caribe, 2021. [Online]. Available: https://bit.ly/3QBManI [3] P. Rodríguez-Pajarón, A. Hernández, and J. V. Milanović,
“Probabilistic assessment of the impact of electric vehicles and nonlinear
loads on power quality in residential networks,” International Journal of
Electrical Power & Energy Systems, vol. 129, p. 106807, 2021. [Online].
Available: https://doi.org/10.1016/j.ijepes.2021.106807 [4] A. A. Ismail, N. T. Mbungu, A. Elnady, R. C. Bansal, A. Kadir Hamid, and M. AlShabi, “Impact of electric vehicles on smart grid and future predictions: a survey,” International Journal of Modelling and Simulation, vol. 43, no. 6, pp. 1041–1057, 2023. [Online]. Available: https://doi.org/10.1080/02286203.2022.2148180 |
[5] A. Jenn and J. Highleyman,
“Distribution grid impacts of electric vehicles: A california
case study,” iScience, vol. 25, no. 1, p. 103686,
2022. [Online]. Available: https://doi.org/10.1016/j.isci.2021.103686 [6] A. Ibrahim and F. Jiang, “The electric vehicle energy management: An overview of the energy system and related modeling and simulation,” Renewable and Sustainable Energy Reviews, vol. 144, p. 111049, 2021. [Online]. Available: https://doi.org/10.1016/j.rser.2021.111049 [7] Y. Sáez, E.
Collado, and M. Serrano, “Modelado de estaciones de recarga lenta para
vehículos eléctricos mediante software: revisión del estado del arte,”
Revista de Iniciación Científica, vol. 7, no. 2, pp. 9–19, 2021. [Online]. Available: https://doi.org/10.33412/rev-ric.v7.2.3334 [8] S. Goel, R. Sharma, and A. K. Rathore, “A review on barrier and challenges of electric vehicle in india and vehicle to grid optimisation,” Transportation Engineering, vol. 4, p. 100057, 2021. [Online]. Available:https://doi.org/10.1016/j.treng.2021.100057 [9] D. T. Sandoval
and E. G. Torres, “Respuesta de demanda de energía por introducción de
vehículos eléctricos: estado del arte,” Revista de I+D Tecnológico, vol. 16,
no. 1, pp. 5–11, 2020. [Online].
Available: https://doi.org/10.33412/idt.v16.1.2433 [10] A. G. Anastasiadis, G. P. Kondylis, A. Polyzakis, and G. Vokas,
“Effects of increased electric vehicles into a distribution network,” Energy
Procedia, vol. 157, pp. 586–593, 2019. [Online]. Available: https://doi.org/10.1016/j.egypro.2018.11.223 [11] H. Das, M. Rahman, S. Li, and C. Tan,
“Electric vehicles standards, charging infrastructure, and impact on grid
integration: A technological review,” Renewable and Sustainable Energy
Reviews, vol. 120, p. 109618, 2020. [Online]. Available: https://doi.org/10.1016/j.rser.2019.109618 [12] A. K. Karmaker, S. Roy, and M. R. Ahmed, “Analysis of the impact of electric vehicle charging station on power quality issues,” in 2019 International Conference on Electrical, Computer and Communication Engineering (ECCE), 2019, pp. 1–6. [Online]. Available: https://doi.org/10.1109/ECACE.2019.8679164 |
|
[13] S. Habib, M. M. Khan, F.
Abbas, L. Sang, M. U. Shahid, and H. Tang, “A comprehensive study of
implemented international standards, technical challenges, impacts and
prospects for electric vehicles,” IEEE Access, vol. 6, pp. 13 866–13 890,
2018. [Online]. Available: https://doi.org/10.1109/ACCESS.2018.2812303 [14] S. Sharma, A. K. Panwar, and
M. Tripathi, “Storage technologies for electric vehicles,” Journal of Traffic
and Transportation Engineering (English Edition), vol. 7, no. 3, pp. 340–361,
2020. [Online]. Available: https://doi.org/10.1016/j.jtte.2020.04.004 [15] L. González, E. Siavichay, and J. Espinoza, “Impact of ev fast charging stations on the power distribution network of a latin american intermediate city,” Renewable and Sustainable Energy Reviews, vol. 107, pp. 309–318, 2019. [Online]. Available: https://doi.org/10.1016/j.rser.2019.03.017 [16] ARCERNNR,
Panorama Electrico. Agencia de Regulación y Control
de Energía y Recursos Naturales No Renovables, 2022. [Online]. Available: https://acortar.link/jikL6I [17] A. Mohammad, R. Zamora, and T. T. Lie, “Integration of electric vehicles in the distribution network: A review of pv based electric vehicle modelling,” Energies, vol. 13, no. 17, 2020. [Online]. Available: https://doi.org/10.3390/en13174541 |
[18] AECERNNR, Regulación Nro. ARCERNNR - 002/20, Calidad del servicio de distribución y comercialización de energía eléctrica. Agencia de Regulación y Control de Energía y Recursos Naturales No Renovables, 2020. [Online]. Available: https://bit.ly/44vx74C [19] EATON. (2024)
Análisis de sistemas de distribución cymdist. EATOn Power Business World
Wide. [Online]. Available: https://bit.ly/3Uu3L1T [20] A. A. N. Espinosa, M. A. D. Verriera, and J. M. Y. nez Castro, “Vehículos eléctricos y el impacto en el sistema de potencia. análisis de la operación y emisiones,” Revista de energía de Latinoamérica y el Caribe ENERLAC, vol. 5, no. 2, pp. 14–39, 2021. [Online]. Available: https://bit.ly/44zJXiw [21] J. Lascano, L. Chiza, R. Saraguro, C. Quinatoa, and J. Tapia, “Estimación de la demanda de una estación de carga para vehículos eléctricos mediante la aplicación de métodos probabilísticos,” Revista Técnica Energía, vol. 20, no. 1, pp. 52–64, 2023. [Online]. Available: https://doi.org/10.37116/revistaenergia.v20.n1.2023.569 |