|
Scientific Paper / Artículo Científico |
|
|
|
|
https://doi.org/10.17163/ings.n31.2024.05 |
|
|
|
pISSN: 1390-650X / eISSN: 1390-860X |
|
|
NETWORK CENTRALITY MEASURES FOR CLASSIFYING IMPORTANT COMPONENTS IN ELECTRICAL POWER SYSTEMS BASED ON LINEGRAPH TRANSFORMATION |
||
|
CLASIFICACIÓN DE ELEMENTOS IMPORTANTES EN SISTEMAS ELÉCTRICOS DE POTENCIA SEGÚN MEDIDAS DE CENTRALIDAD EN REDES Y TRANSFORMACIÓN LINEGRAPH |
||
|
José
A. Moronta R.1,* |
|
Received: 30-06-2023, Received after review: 27-11-2023, Accepted: 30-11-2024, Published: 01-01-2024 |
|
Abstract |
Resumen |
|
Network theory techniques have recently contributed to the analysis of electrical power systems, enabling faster computational solutions. Taking advantage of the topological information of a network, it becomes possible to characterize its elements both locally (individual network components) and globally (interactions and behavior of the components). Identifying the crucial elements within an electrical system involves classifying each component based on its interaction with the entire network, considering, possibly, various operating conditions. Current network centrality measures predominantly focus on nodes, which represent connection buses in the system, to quantify the significance of individual elements. In this study, we employ the linegraph technique to transform links into nodes. Subsequently, we calculate and categorize the links (representing lines and transformers) of different electrical networks found in the literature using three centrality measures. Moreover, our methodology allows for the aggregation or combination of the indices from each measure, leading to a unified classification based on the importance of links in the considered electrical power systems. Analyzing diverse networks reveals a consistent empirical distribution of centrality indices, resulting in similar classifications of significant elements regardless of network size. |
El análisis de sistemas eléctricos de potencia se ha apoyado, recientemente, en la aplicación de técnicas de la teoría de redes, con la finalidad de obtener soluciones computacionalmente más rápidas. A partir de la información topológica de una red, es posible definir características desde lo local (elementos de la red) hasta lo global (comportamiento e interacción de los elementos). La identificación de elementos importantes de un sistema eléctrico, consiste en clasificar cada uno de los elementos desde su interacción con toda la red, y, posiblemente, tomando en cuenta diversas condiciones de operación del sistema. Las medidas de centralidad en redes, que permiten asignar importancia cuantitativa a los elementos de un sistema, están definidas en su mayoría para los nodos (representan buses de conexión) de las mismas. En este trabajo, a partir de la transformación de enlaces a nodos, según la técnica linegraph, se calculan y clasifican los enlaces (representan líneas y transformadores) de diversas redes eléctricas de la literatura, de acuerdo con tres medidas de centralidad. Adicionalmente, el procedimiento presentado permite agregar o combinar los índices de cada medida, y obtener una única clasificación según su importancia para los enlaces de los sistemas eléctricos de potencia considerados. La diversidad de redes analizadas permite concluir que la distribución empírica de los índices de centralidad es similar, y origina una clasificación de elementos importantes semejantes, independiente de la dimensión de la red. |
|
Keywords: Centrality measures, electrical networks, linegraph, link classification |
Palabras clave: clasificación de enlaces, linegraph, medidas de centralidad, redes eléctricas |
|
1,*Departamento de Tecnología Industrial, Universidad Simón Bolívar, Venezuela. Corresponding author ✉: jmoronta@usb.ve. 2Facultad de Ingeniería, Universidad Central de Venezuela, Venezuela.
Suggested citation: Moronta R., J. A. and Rocco S., C. M. “Network centrality measures for classifying important components in electrical power systems based on linegraph transformation,”Ingenius, Revista de Ciencia y Tecnología, N.◦ 31, pp. 55-63, 2024. doi: https://doi.org/10.17163/ings.n31.2024.05. |
|
1. Introduction
Identifying important electrical power systems (EPS) elements involves determining the most relevant components under one or several specific operating conditions. In this regard, the works of various authors [1–3] can be cited. Based on the evaluation of power flows in the EPS, they select elements whose deactivation results in the greatest load rationing. Other researchers have focused on identifying the elements that most affect the vulnerability of EPS [4,5], the elements with the most significant potential to trigger cascading failures in the EPS [6], and the elements that impact the reliability of the EPS [7]. Recently, research on the analysis of power systems has focused on network theory to achieve faster computational solutions. This approach does not involve evaluating the physical equations governing the system’s behavior but relies solely on the topological characteristics of the network [8]. The approach based on centrality measures is widely used to assess the importance of elements in a network, considering exclusively the topology. According to Newman [9], researchers aim to answer the following question: What are the most important or central nodes in a network? Although most centrality measures are defined for nodes in the system, some scientists have extended node centrality [10] to links. Considering this, the previous question can be answered from the perspective of network links. In the case of electrical power systems, the links (representing energy transmission lines or electrical transformers) are more important than in other types of systems. As pointed out by Ortiz et al. [11], centrality measures (considered on the links) are helpful because they enable an understanding of the importance of a link that connects with other links to facilitate the flow of electrical energy between sources and loads. Some authors [11, 12] focus on transforming the original network into an equivalent one, converting the links from the original network into nodes in the equivalent network. In this equivalent network, node centrality metrics can be assessed, allowing for an indirect determination of the importance of the links in the original network. This transformation is based on the mathematical concept known as linegraph [13], which involves creating a new equivalent graph L(G) from a graph G, where the nodes of L(G) represent the links of G. This work aims to classify the links (transmission lines and/or transformers) of network G according to their level of importance by transforming network G, representing the topology of an EPS, into a new network L(G) using the linegraph [13] and evaluating centrality measures in networks. To achieve this, the technique of ordered list aggregation is employed, which allows combining |
multiple lists into a single entity. Aggregation poses a common challenge in social sciences, statistics, and other fields, where it is necessary to merge different ordered lists according to a specific criterion [14].
1.1.Previous studies
The authors cited in [15] and [8] analyze the Italian electrical system (hviet) and the Venezuelan electrical system (SENTRONCAL), respectively, from the perspective of complex networks. The importance of topology in characterizing the network is determined, although evaluations and classifications of elements mainly focus on the nodes of the electrical system. On the other hand, Hines and Blumsack [16] point out a clear connection between the network’s topology and its vulnerability. This work [16] defines a measure called “equivalent electrical distance between pairs of nodes” based on information centrality measures [17, 18]. Some researchers [19] assess various electrical systems from the literature (IEEE30, IEEE57 and IEEE 118) using centrality measures modified to incorporate electrical parameters. The considered measures are Degree centrality, Closeness centrality, and Betweenness centrality, all evaluated at the network nodes. Subsequently, Nasiruzzaman and Pota [6] propose a method to assess the stability of power systems based on network theory. They employ, as a centrality measure, an extension of the concept of Betweenness centrality called Edgebetweenness centrality; in other words, a centrality measure applied to network links. Article [19] proposes an enhanced model of the closeness centrality index to identify critical nodes in cascading failure processes within networks. Chen et al. [5] suggest an index called "weighted line betweenness" to pinpoint essential transmission lines (network links). This identification is not solely based on their electrical power capacity but also on their topological arrangement in the network. Amani and Jalili [4] provide a review of vulnerability and resilience analysis in power systems from the perspective of complex network theory. They identify a set of measures and indices, emphasizing a summary where specific measures for nodes and links are mentioned, including some that are centrality measures or centrality measures adapted to electrical networks. Nakarmi et al. [7] conduct a classification of reliability analysis in power systems using graphs and the interaction of their elements. A significant subclassification they perform is the "identification of critical components". This reliability analysis focuses on finding critical nodes/transmission lines (links) by analyzing the structural properties of the graphs. They use standard centrality measures or define new |
|
graphbased metrics, which typically incorporate electrical characteristics into the standard measure [20–22]. Bröhl and Klaus [10] point out that while there are many methods for measuring the centrality of individual nodes, there are few metrics for measuring the centrality of individual links. Consequently, they propose modifications to widely used centrality concepts for nodes to be applied to network links, thereby identifying important links or sets of links. They specifically focus on three indices:
· Betweenness centrality · Closeness centrality · Eigenvector centrality
Ortiz et al. [11] utilize the mathematical concept called linegraph [13], wherein, from an original graph G, a new graph L(G) can be created, with its nodes representing the links of G. This facilitates the application of traditional centrality measures for nodes to the links in the network, based on this new graph L(G). This proposal enables the identification of important links in the network, applying centrality indices to links in social networks such as Facebook. They also suggest that this could provide information about the importance of a link interconnected with others to facilitate the flow of information between sources and destinations. Built upon the concept of linegraph L(G) [13], this work aims to classify important links in electrical networks, quantifying their centrality values. An aggregation of the previously ordered lists is carried out to generate a unique classification of the importance of elements, considering and integrating various centrality measures employed. A comparison of the distribution of centrality values in different electrical networks analyzed in the literature is conducted.
2. Materials and methods
2.1.Preliminary definitions
2.1.1. Graph
A network, including power systems, can be modeled as a graph G = (V,E) where V = {v1, ..., vn} represents the set of nodes (system connection buses) and E = {e1, ..., em} represents the set of links connecting the nodes of the graph (transmission lines and transformers). The number of nodes is n = |V |, and the number of links is m = |E|. |
Then, A(G) = (aij) represents the adjacency matrix of the graph G with order n x n, where aij indicates a connection between nodes vi and vj , aij = 1 if vi y vj are connected, and aij = 0 if they are not. On the other hand, B(G) = (bij) represents the incidence matrix of G with order n x m, where bij = 1 if vi and vj are incident, and bij = 0 when they are not.
2.1.2. Linegraph
The Line Graph L(G) is a graph whose nodes represent the links of the original graph G and A(L(G)) denotes its adjacency matrix. Equation (1) represents the adjacency matrix of L(G) with order m x m. Then:
Where Im is the identity matrix of dimension m x m. Figure 1 shows examples of simple graphs (left) with their corresponding L(G) (right). The original nodes are not considered in the L(G) graphs, resulting in a graph where nodes correspond to links. For instance, in the graph shown in the top left of Figure 1, with nodes {1, 2, 3} and links a = (1, 2) and b = (2, 3), it transforms into another graph with only two nodes {a, b} and a single link {2}.
Figure 1. Graphs G on the left with their corresponding L(G) on the right. The nodes in L(G) represent the links in G.
|

|
2.1.3. Measures or centrality indices Betweenness centrality (Betweenness centrality [23])
According to [24], the betweenness centrality of a node k can be defined according to Equation (2):
Where {k, i, j} εV and qij is the number of shortest paths between nodes i and j passing through node k. Gij is the total number of shortest paths between vertices i and j. Closeness centrality (Closeness centrality [23]). The closeness centrality of the node (for a node k) is defined according to Equation (3):
With {k, l} εV , where dkl denotes the shortest path length from node k to node l. Eigenvector centrality
(Eigenvector centrality [23]). The eigenvector
centrality of the node (node k) is defined as the k-th entry of the
eigenvector
2.2.Procedure for classifying links according to their importance
In an EPS, considering its topology exclusively, the graph G = (V,E). Then, L(G) can be determined, where its nodes represent the links of the original graph G. Subsequently, the following is determined based on this equivalent graph L(G):
· Betweenness centrality · Closeness centrality · Eigenvector centrality
The three mentioned centrality measures are determined for each link of the electrical power system represented as nodes in the equivalent graph L(G). These measures are normalized and arranged from highest to lowest, |
allowing for the classification of the link’s importance according to the provided index. Afterwards, the links can be classified as important based on a pre-established index value. For instance, it can be stipulated that links with values exceeding 0.9 are deemed the most important in the network or according to any other criterion established by the decision-maker. After obtaining each list or ranking for the considered centrality indices, a general classification of the elements combining the characteristics measured by each index separately can be generated. This allows determining a unique order of importance for each element. This work employs a method to combine ordered lists based on their importance, determining a compromise order in which the differences or distances from the ordered lists are minimal. Naturally, other techniques, such as multicriteria decision methods [25], can be considered to determine the combined order. The list combination method used in this work is found in the RankAgregg library [14] of the R software [26]. The distances between the sought compromise order and each ordered list are calculated using the Spearman similarity index, and optimization (minimization of the sum of distances) is achieved using a heuristic based on the Cross-Entropy Monte Carlo algorithm [27]. As with any heuristic, an optimal solution is not guaranteed for large-scale problems. Figure 2 illustrates the complete aggregation process for selecting link groups in the considered EPS.
Figure 2. Classification process of important elements in an EPS considering centrality measures.
2.3. Illustrative example of the procedure
To illustrate the procedure described in Figure 2, an EPS represented by the graph in Figure 3 (left) is considered. Using the linegraph technique (available in the igraph library [28]), the equivalent graph, where links are now presented as nodes, is obtained, as shown in Figure 3 (right). For example, the link h connecting nodes 5 and 6 in the graph of Figure 3 (left) corresponds to node h in the graph of Figure 3 (right). |

|
Figure 3. Representative graph of a 9-node EPS (left)-Equivalent graph (line-graph) of a 9-node EPS using linegraph (right)
For the equivalent graph shown in Figure 3 (right), the centrality indices (EB, EC, and EE) are calculated using functions coded in the igraph library [28] of the R v4.2.2 statistical software [26]. Table 1 displays the centrality index values of the considered links, ordered from most important to least important. It is observed that no single link emerges as the most important when all three centrality indices are simultaneously considered. Consequently, there is a need to establish a compromise ranking. Table 1 provides details of the elements (from-to) corresponding to the graph in Figure 3 (left).
Table 1. Rankings for each index of the links of the representative graph of a 9-node EPS.
Ultimately, the five most significant elements of the combined ordered list, also known as the superlist of links, are presented in Table 2. This list simultaneously incorporates all three indices using the RankAgregg package in the statistical software R v4.2.2 [26]. To achieve this, the RankAgregg method [14] is iteratively implemented a thousand times on the network, and positions in the list are determined based on the highest frequency of element occurrence at each position.
|
Table 2. Ordered list of the 5 most important elements of the links in the representative graph of a 9-node EPS, sorted from highest to lowest.
It is worth emphasising that this ordering is robust, as it persists even after running the selected aggregation algorithm a thousand times based on an optimization heuristic.
3. Results and discussion
The procedure for identifying important elements in an electrical power system is implemented in a set of 16 EPS [29], where only the topology associated with each system is utilized. Table 3 displays the number of nodes and links corresponding to each analyzed network.
Table 3. Topology of the electrical power systems considered [29]
Figure 4 illustrates the distribution of centrality measures for each network mentioned in Table 3. To achieve this, the value of each considered centrality measure (EB, EC, and EE) is determined and normalized to compare the networks of the 16 power systems. In the case of the EB and EE indices, the distributions are primarily concentrated at low values (to the left), except for networks with few nodes (IEEE24 and IEEE30) exhibiting greater dispersion. Meanwhile, the EC index demonstrates a more equitable distribution. |


|
A specific network is considered, such as the IEEE57 network, composed of 80 links. In Figure 5, the normalized values of centrality measures for each of the 80 links in the network are displayed, highlighting links 17, 21, and 33 with the highest values in all three evaluated indices. It is noteworthy that there is not a single, more important link (technically, a link that dominates over the rest of the links simultaneously), and there are indices that assess the importance of each link differently. Thus, it is necessary to determine a unique ranking that combines the relative importance of each index.
Figure 4. Probability density of centrality values (EB, EE, and EC) in electrical power systems from the literature in Table 2
Figure 5. Values of each considered index (top: Betweenness centrality (EB); middle: Closeness centrality (EC); bottom: Eigenvector centrality (EE)) for the links of the IEEE57 network. |
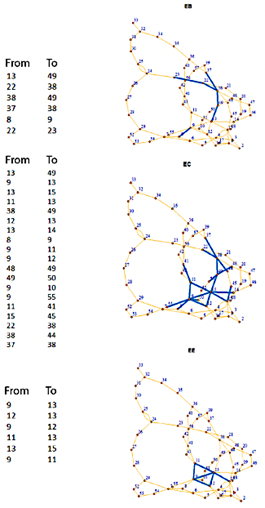
For the same IEEE57 network, it is determined that the decision-maker sets a minimum value of 0.70 for normalized centrality indices to classify a link as important in the network. On the left side of Figure 6, the ordered list of important links (index values exceeding 0.70) is displayed for each specific index. The network’s topology is presented on the right, highlighting the important links (blue line) following the aforementioned criterion.
Figure 6. Important links according to specific centrality indices (top: Betweenness centrality (EB); middle: Closeness centrality (EC); bottom: Eigenvector centrality (EE)), with their associated graphs (important links are highlighted in blue).
Each index orders the links differently. For instance, the link connecting nodes 13-49 (link 33) is classified as the most important according to centrality indices: Betweenness centrality (EB) and Closeness centrality (EC); however, it does not appear in the list of important links according to Eigenvector centrality (EE). The algorithm for aggregating ordered lists mentioned earlier [14] is used to obtain a ranking that considers all indices simultaneously. Figure 7 displays the network L(G) corresponding to IEEE57 and the first ten elements of the ordered list corresponding to links 33, 21, 32, 25, 64, 28, 31, 17, 19 and 20 (arranged from most important to least important). |


|
Figura 7. Network corresponding to the IEEE57 system with the first ten links ranked according to their importance and highlighted in blue.
Considering the original graph representing the IEEE57 network, the ten most important links are those shown in Table 4.
Table 4. Ordered list of importance of links in the graph representing the IEEE57 EPS.
Figure 7 shows that the most important elements result from the individual lists of centrality indices. For instance, the element connecting node 13 to node 49 is the most important in the aggregated list, exhibiting the highest values in the EB and EC indices. However, it is positioned seventh in the EE index (with a value of 0.65 < 0.7). The number of links to be considered important can be previously defined by the decision-maker. On the other hand, the combined list of links considered important can be used as a baseline for additional analyses of the electrical system (e.g., protection, vulnerability, or resilience studies), thereby reducing the analysis space to the set of important elements. In the case of the IEEE57 network, the first ten elements considered important represent less than 15% of the total links in the network, which can decrease the number of |
potential assessments requiring high computational demand, especially in networks with a more significant number of elements.
4. Conclusions
This study proposes a framework that facilitates the determination of a ranked list based on the importance of links in an electrical network, utilizing a set of centrality indices. To achieve this, the original network is transformed into an equivalent one, where links are represented as nodes. In this equivalent network, a set of centrality indices is assessed (typically, these indices are designed for nodes and not for links). Three specific centrality indices are employed in this study, although any set of centrality indices could be utilized. Subsequently, a unique ranking is derived from these lists, integrating the individually considered properties and establishing an order of importance for the network elements. This procedure was evaluated on a set of networks that share the characteristic of representing the topology of electrical power systems, varying in scale, originating from different regions of the world, and possibly following different design criteria. The results suggest that the estimated statistical distribution of centrality index values exhibits similar behavior. The indices evaluated in this study consistently suggest that the most important links are located in the "center" of the network, enabling connections with more peripheral links. It is worth noting that for the classification of elements in the network, no evaluation of the specific dynamics of the network is required; in fact, no additional information beyond the network’s topology (connections from-to) is needed. Therefore, the proposed procedure could be applied for faster assessments than conventional ones in power systems with incomplete information or simply as input that narrows down possible solutions in a comprehensive evaluation considering the equations modeling the electrical phenomenon. On the other hand, the omission of the specific electrical phenomenon that enables the evaluation and classification of elements in the power system constitutes a limitation for this procedure. This is because important elements, which would only be correctly classified by the inherent nature of the problem, could be overlooked.
|


|
The future extension of this procedure is proposed in two fundamental directions. Firstly, it is suggested to consider centrality measures specifically designed for electrical systems, incorporating properties of links such as capacities, impedances, and other relevant characteristics. Secondly, comparing the results obtained with different schemes for evaluating important components based on functional analyses of electrical systems, such as stability, power flows, or other relevant parameters, is recommended.
References
[1] V. Donde, V. López, B. Lesieutre, A. Pinar, C. Yang, and J. Meza, “Identification of severe multiple contingencies in electric power networks,” in Proceedings of the 37th Annual North American Power Symposium, 2005., 2005, pp. 59–66. [Online]. Available: https://doi.org/10.1109/NAPS.2005.1560502 [2] J. Arroyo and F. Galiana, “On the solution of the bilevel programming formulation of the terrorist threat problem,” IEEE Transactions on Power Systems, vol. 20, no. 2, pp. 789–797, 2005. [Online]. Available: https://doi.org/10.1109/TPWRS.2005.846198 [3] C. Rocco, J. Ramírez-Márquez, D. Salazar, and C. Yajure, “Análisis preliminar de la vulnerabilidad de un sistema de potencia mediante interdicción determinista multiobjetivo,” Revista de la Facultad de Ingeniería Universidad Central de Venezuela, vol. 25, pp. 61–69, 03 2010. [Online]. Available: https://bit.ly/46JapWe [4] A. M. Amani and M. Jalili, “Power grids as complex networks: Resilience and reliability analysis,” IEEE Access, vol. 9, pp. 119 010–119 031, 2021. [Online]. Available: https://doi.org/10.1109/ACCESS.2021.3107492 [5] X. Chen, K. Sun, Y. Cao, and S. Wang, “Identification of vulnerable lines in power grid based on complex network theory,” in 2007 IEEE Power Engineering Society General Meeting, 2007. [Online]. Available: https://doi.org/10.1109/PES.2007.385733 [6] A. B. M. Nasiruzzaman and H. R. Pota, “Transient stability assessment of smart power system using complex networks framework,” in 2011 IEEE Power and Energy Society General Meeting, 2011. [Online]. Available: https://doi.org/10.1109/PES.2011.6038970
|
[7] U. Nakarmi, M. Rahnamay Naeini, M. J. Hossain, and M. A. Hasnat, “Interaction graphs for cascading failure analysis in power grids: A survey,” Energies, vol. 13, no. 9, 2020. [Online]. Available: https://doi.org/10.3390/en13092219 [8] C. M and R. S, “Análisis del sistema eléctrico venezolano desde la perspectiva de la teoría de redes complejas,” Revista de la Facultad de Ingeniería Universidad Central de Venezuela, vol. 23, pp. 103–109, 03 2008. [Online]. Available: https://bit.ly/3t2BIgk [9] M. Newman, Networks: An Introduction (1st edn). Oxford Academic, 2010. [Online]. Available: https://doi.org/10.1093/acprof:oso/9780199206650.001.0001 [10] T. Bröhl and K. Lehnertz, “Centrality-based identification of important edges in complex networks,” Chaos: An Interdisciplinary Journal of Nonlinear Science, vol. 29, no. 3, Mar. 2019. [Online]. Available: http://dx.doi.org/10.1063/1.5081098 [11] R. Ortiz-Gaona, M. Postigo-Boix, and J. L. Melus-Moreno, “Centrality metrics and line-graph to measure the importance of links in online social networks,” International Journal of New Technology and Research, vol. 2, no. 12, 12 2016. [Online]. Available: https://bit.ly/3Ru4rnR [12] O. de la Cruz Cabrera, M. Matar, and L. Reichel, “Edge importance in a network via line graphs and the matrix exponential,” Numerical Algorithms, vol. 83, no. 2, pp. 807–832, Feb 2020. [Online]. Available: https://doi.org/10.1007/s11075-019-00704-y [13] F. Harary, Graph Theory. Addison-Wesley Publishing Company. University of Minnesota, 1969. [Online]. Available: https://bit.ly/4a9HYDV [14] V. Pihur, S. Datta, and S. Datta, “Rankaggreg, an R package for weighted rank aggregation,” BMC Bioinformatics, vol. 10, no. 1, p. 62, Feb 2009. [Online]. Available: https://doi.org/10.1186/1471-2105-10-62 [15] P. Crucitti, V. Latora, and M. Marchiori, “A topological analysis of the italian electric power grid,” Physica A: Statistical Mechanics and its Applications, vol. 338, no. 1, pp. 92–97, 2004, proceedings of the conference A Nonlinear World: the Real World, 2nd International Conference on Frontier Science. [Online]. Available: https://doi.org/10.1016/j.physa.2004.02.029
[16] P. Hines and S. Blumsack, “A centrality measure for electrical networks,” in Proceedings of the 41st Annual Hawaii International Conference on System Sciences (HICSS 2008), 2008, pp. 185–185. [Online]. Available: https://doi.org/10.1109/HICSS.2008.5 [17] K. Stephenson and M. Zelen, “Rethinking centrality: Methods and examples,” Social Networks, vol. 11, no. 1, pp. 1–37, 1989. [Online]. Available: https://doi.org/10.1016/0378-8733(89)90016-6 [18] S. Wasserman and K. Faust, Social Network Analysis: Methods and Applications, ser. Structural Analysis in the Social Sciences. Cambridge University Press, 1994. [Online]. Available: https://doi.org/10.1017/CBO9780511815478 |
|
[19] A. B. M. Nasiruzzaman, H. R. Pota, and M. A. Mahmud, “Application of centrality measures of complex network framework in power grid,” in IECON 2011 - 37th Annual Conference of the IEEE Industrial Electronics Society, 2011, pp. 4660–4665. [Online]. Available: https://doi.org/10.1109/IECON.2011.6120079 [20] S. Arianos, E. Bompard, A. Carbone, and F. Xue, “Power grid vulnerability: A complex network approach,” Chaos: An Interdisciplinary Journal of Nonlinear Science, vol. 19, no. 1, p. 013119, Feb 2009. [Online]. Available: https://doi.org/10.1063/1.3077229 [21] K. Wang, B. Zhang, Z. Zhang, X. Yin, and B. Wang, “An electrical betweenness approach for vulnerability assessment of power grids considering the capacity of generators and load,” Physica A: Statistical Mechanics and its Applications, vol. 390, no. 23, pp. 4692–4701, 2011. [Online]. Available: https://doi.org/10.1016/j.physa.2011.07.031 [22] E. Bompard, R. Napoli, and F. Xue, “Analysis of structural vulnerabilities in power transmission grids,” International Journal of Critical Infrastructure Protection, vol. 2, no. 1, pp. 5–12, 2009. [Online]. Available: https://doi.org/10.1016/j.ijcip.2009.02.002 [23] R. Herrero and M. Herrero, “La terminología del análisis de redes. Problemas de definición y de traducción,” Política y sociedad, 2000, vol. 33, 01 2000. [Online]. Available: https://bit.ly/46P6IOK |
[24] M. E. J. Newman, “Scientific collaboration networks. II. Shortest paths, weighted networks, and centrality,” Phys. Rev. E, vol. 64, p. 016132, Jun 2001. [Online]. Available: https://doi.org/10.1103/PhysRevE.64.016132 [25] M. Aruldoss, M. Lakshmi, and V. P. Venkatesan, “A survey on multi criteria decision making methods and its applications,” Science and Education Publishing, vol. 11, pp. 31–43, 2013. [Online]. Available: https://bit.ly/3GO3wbP [26] R. Core Team, R: A language and environment for statistical computing. Foundation for Statistical Computing, Vienna, Austria, 2022. [Online]. Available: https://bit.ly/484HuNg [27] V. Pihur, S. Datta, and S. Datta, “Weighted rank aggregation of cluster validation measures: a Monte Carlo cross-entropy approach,” Bioinformatics, vol. 23, no. 13, pp. 1607–1615, 2007. [Online]. Available: https://doi.org/10.1093/bioinformatics/btm158 [28] G. Csardi and T. Nepusz, “The igraph software package for complex network research,” Inter-Journal, vol. Complex Systems, p. 1695, 11 2005. [Online]. Available: https://bit.ly/3TdyNfs [29] C. M. Rocco, K. Barker, and J. Moronta, “Determining the best algorithm to detect community structures in networks: application to power systems,” Environment Systems and Decisions, vol. 42, pp. 251–264, 2022. [Online]. Available: https://doi.org/10.1007/s10669-021-09833-z |