|
Scientific Paper / Artículo Científico |
|
|
|
|
https://doi.org/10.17163/ings.n31.2024.04 |
|
|
|
pISSN: 1390-650X / eISSN: 1390-860X |
|
|
ELECTRIC SUBSTATION INSPECTION: YOLOV5 IN HOTSPOT DETECTION THROUGH THERMAL IMAGING |
||
|
INSPECCIÓN DE SUBESTACIONES ELÉCTRICAS: YOLOV5 EN LA IDENTIFICACIÓN DE PUNTOS CALIENTES MEDIANTE IMÁGENES TÉRMICAS |
||
|
Daniel
A. Pérez-Aguilar1,*3 Redy
H. Risco-Ramos2 |
|
Received: 11-10-2023, Received after review: 27-11-2023, Accepted: 06-12-2023, Published: 01-01-2024 |
|
Abstract |
Resumen |
|
Substations are key facilities within an electrical system, untimely failures tend to cause low quality and negative effects on the electrical supply. An early indicator of potential electrical equipment failure is the appearance of hot spots; therefore, its detection and subsequent programmed correction avoids incurring in major failures and unnecessary operation stops. In this research, 64 experiments of the YOLOv5 algorithm were carried out, with the purpose of proposing an automated computer vision mechanism for the detection of hot spots in thermal images of electrical substations. The best results show a mAP value of 81.99%, which were obtained with the YOLOv5m algorithm and the transfer learning application. These results leave a basis to deepen and improve the performance of the algorithm by varying other hyperparameters to those considered in this study. |
Las subestaciones son instalaciones clave dentro de un sistema eléctrico; las fallas intempestivas tienden a causar baja calidad y efectos negativos del suministro eléctrico. Un indicador temprano de posibles fallas en los equipos eléctricos es la aparición de puntos calientes; por lo que su detección y posterior corrección programada evita incurrir en fallas mayores y paradas de operación innecesarias. En esta investigación se realizaron 64 experimentos del algoritmo YOLOv5, con la finalidad de proponer un mecanismo automatizado de visión por computadora para la detección de puntos calientes en imágenes térmicas de subestaciones eléctricas. Los mejores resultados muestran un valor mAP de 81,99 %, los cuales se obtuvieron con el algoritmo YOLOv5m y la aplicación de transfer learning. Estos resultados dejan una base para profundizar y mejorar el desempeño del algoritmo, variando otros hiperparámetros a los considerados en el presente estudio. |
|
Keywords: Electrical substations, Hot spots, Object detection, Thermal images, Transfer learning, YOLOv5 |
Palabras clave: aprendizaje por transferencia, detección de objetos, imágenes térmicas, puntos calientes, subestaciones eléctricas, YOLOv5 |
|
1,*Facultad de Ingeniería, Universidad Tecnológica del Perú, Perú. Corresponding author ✉: daniel.perez@upn.pe. 2Facultad de Ingeniería, Universidad de Piura, Perú. 3Facultad de Ingeniería, Universidad Privada del Norte, Perú.
Suggested citation: Pérez-Aguilar, D.A.; Pérez-Aguilar, J.M; Pérez-Aguilar, A.P.; Risco-Ramos, R. H. and Malpica- Rodríguez, M.E. “Electric substation inspection: YOLOv5 in hotspot detection through thermal imaging,” Ingenius,Revista de Ciencia y Tecnología, N.◦ 31, pp. 43-54 2024, doi: https://doi.org/10.17163/ings.n31.2024.04. |
|
1. Introduction
Electric substations are facilities composed of equipment necessary for voltage, frequency, phase quantity transformations, or circuit connections. This type of equipment is often situated near power generation plants or in non-urban areas [1, 2]. Ensuring the adequate quality of the electrical supply mandates that these pieces of equipment remain operational for most of their lifespan [3, 4]. It is customary for faults in electric substations to be anticipated by the emergence of what specialists refer to as hotspots. These elements exhibit a temperature above their regular operation compared to other equipment with similar characteristics and operating conditions [5]. Hotspots usually arise due to an increase in electrical resistance in a circuit, resulting from various factors such as dirt, false contacts, overcurrents, load imbalances, and insulation loss, among others. These hotspots are not visible to the naked eye, so their detection requires specialized techniques such as infrared thermography. However, the analysis must be carried out manually by an expert or specialist in the field, involving a significant time investment and the risk of human errors in the diagnosis [6]. This non-invasive technique is employed for measuring the temperature of various objects without the need for direct physical contact. To perform this measurement, the infrared radiation from the electromagnetic spectrum is captured using thermal cameras, which generate images in the infrared spectrum [7]. Artificial Intelligence (AI) is a discipline that has had a significant technological impact in recent years and is being applied in various sectors, including the electrical field [8]. The combination of thermography and AI techniques encompasses a wide range of applications, such as predictive maintenance in industrial environments, assessment of built structures, identification of energy losses, detection of thermal bridges, location of gas emissions, identification of areas with elevated temperatures, medical research, weather forecasting, military applications, among others [9]. Object detection is a crucial aspect of artificial intelligence and computer vision, aiming to identify one or multiple objects in images or videos. Within the domain of object detection, algorithms are broadly categorized into two primary groups: (i) Manual extraction (handcrafted features) and (ii) Automatic extraction (based on deep learning). The latter category is subdivided into one-stage and two-stage object detection algorithms, with the former achieving detections in less time (See Figure 1) [10]. |
Figure 1. Object detection algorithms [11]
YOLO, an acronym for "You Only Look Once," stands out as a prominent object detection algorithm, particularly notable for its real-time detection and recognition of multiple objects. In contrast to alternative algorithms like SSD or Faster R-CNN, YOLO approaches detection as a regression problem, delivering probabilities linked to each identified class within a single algorithmic execution. The distinctive strengths of YOLO encompass its (i) rapid processing speed, facilitating real-time detection; (ii) exceptional accuracy attributed to a notably low error rate; and (iii) noteworthy learning capacity [12]. YOLOv5, the fifth iteration of the YOLO algorithm, is presented as a one-stage object detector, emerging as one of the most viable options for realtime object detection (FPS) [13]. Figure 2 illustrates the architecture of YOLOv5, unveiling the algorithm’s custom layers, predominantly composed of convolutions and max-pooling. Additionally, the pseudocode for YOLOv5 is provided in Figure 3. Mathematically (see equation (1)), the model predicts the coordinates bx, bx, bw, bh of bounding boxes and the confidence C, indicating the presence of an object in each cell of an SxS grid. Each cell is responsible for detecting the objects within it. These predictions are derived by applying a sigmoid function (σ) to the output of a neural network, where Wrepresents the neural network’s weights, f(x) is the input, and b is the bias. The model generates these predictions for B boxes, enabling it to detect multiple objects in a single pass, rendering it efficient for real-time detection. YOLOv5 primarily incorporates three techniques: (i) the use of residual blocks, (ii) bounding box regression, and (iii) intersection over union (IOU) [14]. Figure 4 illustrates the results of the combination of these three techniques.
|

|
Figure 2. Architecture of YOLOv5 [15]
Figure 3. Pseudocode - YOLOv5 [15]
Figure 4. Figure 4. YOLOv5 – Combination of techniques [14]
Here is a compilation of prior research and studies related to this topic. To ensure the integrity of electrical power systems, an investigation was carried out employing a convolutional neural network (CNN) based on the YOLO object detection algorithm. Predictions were made concerning the coordinates, orientation angle, and classification of each equipment component. Experimental results suggest that this approach is resilient to noise, attaining an accuracy level of 93.7% by using a graphics processing unit (GPU) during the training phase [16]. Power equipment is a crucial energy system component, constituting the focal point of operation and maintenance. According to Li [17], infrared anomaly detection technology is an effective |
method for identifying faults in electrical equipment due to its safety, simplicity, and intuitiveness. The implementation of YOLOv3 was proposed using a set of infrared images collected in the field, achieving an mAP (Mean Average Precision) value of 34.63% and a recovery rate of 21%. Greco et al. [18] point out that faults commonly appear as hotspots on the surface of photovoltaic panels. Consequently, they conducted an investigation focused on hotspot detection using YOLO. The study demonstrated that this algorithm can segment panels in an image efficiently. A quantitative evaluation was carried out, including a comparison with previously established approaches for photovoltaic panel detection. The experimental results obtained affirmed the robustness and effectiveness of YOLO. The use of CNN demands high computational and memory capacity. Nguyen et al. [19] proposed an object detection method based on a CNN and YOLO, considering the PASCAL VOC labeling format. The model achieved an mAP value of 64.16%. A comparative study of three object detection algorithms in images [12] revealed that (i) Single Shot Detector or SSD [20] performs poorly in detecting small objects compared to Faster R-CNN. SSD has the disadvantage of requiring an extensive dataset and data augmentation techniques for training, which is computationally expensive and increases the execution time. (ii) Faster R-CNN [21] is more accurate, but its algorithmic complexity involves a prolonged training time. Additionally, Faster R-CNN is considerably slower than YOLO and requires analyzing each image multiple times, unlike YOLO. Finally, (iii) YOLO [22] stands out for its optimized and efficient model compared to SSD and Faster R-CNN. The latest versions of the algorithm offer low latency and improvements in training and execution time. YOLO also allows realtime operation and better accuracy, especially when employing transfer learning techniques [23]. Regarding traditional object detection techniques, some of the most commonly used include K-means clustering, support vector machines, fuzzy systems, and Histograms of Oriented Gradients (HOG), among others [24], which have demonstrated precision levels exceeding 80%. However, the primary purpose of this article is not to delve into traditional techniques but to provide alternatives based on modern and specific algorithms for object detection, such as YOLOv5. Nevertheless, Table 1 (compiled from [24–26]) presents a comparison between traditional techniques and YOLOv5, highlighting the superiority of YOLOv5 in key aspects for object detection. |


|
Table 1. Comparison between YOLOv5 and traditional techniques
|

|
It is worth mentioning that YOLO has various applications; however, according to the literature analysis, these techniques have not been employed to identify hotspots in thermal images of electrical substations, representing an innovative approach. Therefore, this study is a continuation of an investigation previously published by the authors in this prestigious journal [27]. The aim is to examine the performance of four versions of the YOLOv5 algorithm by conducting 64 experiments applied to hotspot detection. To achieve this, a set of thermal images from electrical substations captured by an energy distribution company in northern Peru is employed. The paper begins with a detailed description of the algorithm and the methodology employed. Subsequently, the results are presented, and the corresponding conclusions are outlined.
2. Materials and methods
The research began with capturing thermal images, followed by the labeling process, preprocessing procedures, and dataset division. Subsequently, the pre-trained weights of YOLOv5 versions YOLOv5s (small), YOLOv5m (medium), YOLOv5l (large), and YOLOv5x (extra-large) were obtained. After this, 64 experiments were conducted and evaluated using various metrics. Figure 5 illustrates the implementation process. The details of the process are outlined in the subsequent sections.
2.1.Field data collection
The methodology began with the collection of field data through thermal image capture. To facilitate this procedure, the TP8S infrared camera was employed, characterized by a spectral range of 8-14 μm, an FPA detector (384x288 pixels, 35 μm), a 22°×16°/35 mm field of view, automatic electronic focus, thermal sensitivity ranging from 0.08 °C a 130 °C, and a continuous zoom capability from ×1 to ×10. |
Figure 5. Steps for the implementation of YOLOv5.
Figure 6. Electromagnetic spectrum of an electrical substation |


|
The data source employed in this study consists of 815 thermographic images acquired by professionals from an entity dedicated to the distribution of electrical energy in the northern region of Peru. Figure 6 illustrates an example of generating a thermographic image of an electrical substation by capturing radiation in the electromagnetic spectrum. These images displayed a 384 × 288 pixels resolution and were classified into two main classes: electrical lines and electrical substations (See Table 2).
Table 2. Distribution of the original dataset
2.2.Dataset labeling
This dataset was labeled by a specialist in hotspot detection within thermographic images using the Guide IrAnalyser and LabelImg tools. Each identified hotspot was linked to a corresponding text file for the underlying image, documenting the object class and its coordinates in a specific format: [category number] [Xcoordinate of the object’s center] [Y-coordinate of the object’s center] [object width in X direction] [object width in Y direction]. Figure 7 illustrates the format employed to represent two hotspots. This format is reiterated in each row according to the number of identified and labeled hotspots.
Figure 7. Text file – 2 hotspots
2.3.Preprocessing and dataset splitting
During the image preprocessing stage, histogram normalization was performed to adjust the pixel intensity distribution in each thermal image, thereby enhancing its inherent characteristics. At the outset, 815 images were available, comprising 342 images of power lines and 473 of electrical substations, as outlined in Table 2. Nevertheless, after labeling images with hotspots, the number of images was |
reduced to 138. Out of these, 116 pertained to substations and 22 to power lines. Consequently, this study was exclusively dedicated to the analysis of electrical substations. Subsequently, the images were uploaded to the Roboflow platform, and using the "hold-out" splitting technique, three datasets were generated: (i) a set of 81 images designated for training, (ii) a set of 23 images for validation, and (iii) a set of 12 images for testing. Data augmentation techniques were implemented to increase the number of images and enhance training effectiveness, incorporating transformations such as horizontal inversion, vertical inversion, rotation, shearing, and cropping. This led to an expanded dataset comprising 278 images: (i) 243 images for training, (ii) 23 for validation, and (iii) 12 for testing. Andrew Yan-Tak Ng, director of the Artificial Intelligence Laboratory at Stanford University, states the following in an article published in Spectrum, a journal edited by IEEE: “In various industries, having millions of data to train artificial intelligence models is challenging; therefore, having a small quantity of truly good or high-quality images can be useful for building defect inspection systems. In addition, accuracy increases when working with the weights of pre-trained models” [28].
2.4.Download of pre-trained weights
The pre-trained weights of the four algorithms belonging to YOLOv5 were downloaded to enhance the solution’s performance. These pre-trained weights were applied to the convolutional layers of the detector, significantly contributing to increased accuracy percentages and reduced training process durations. Table 3 provides detailed information about the pre-training weights associated with each algorithm and the number of parameters contained in each algorithm. It is noteworthy that YOLOv5s stands out as the least complex algorithm, whereas YOLOv5x is the most sophisticated regarding parameters and complexity.
Table 3. Weight and parameters of each algorithm
|


|
2.5.Model training
A total of 64 experiments were conducted on the Google Colaboratory (Colab) platform, as detailed in Table 4. The free version of Colab provides an Intel Xeon processor with 2.30 GHz, an NVIDIA Tesla K80 GPU accelerator, 13 GB of RAM, and 40 GB of disk space.
Table 4. Weight and parameters of each algorithm
|
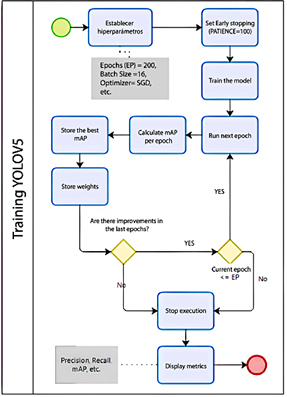
The hyperparameters used included a learning rate of 0.01, a momentum of 0.937, a weight decay of 0.0005, 200 epochs, 4 batch sizes, and the SGD optimizer. To prevent model overfitting, the "Scaled weight decay" regularization and the "Early stopping" technique were incorporated and configured with a patience of 100, meaning the model will halt training if no improvements are observed in the last 100 epochs. Additionally, the weights from the best epochs are stored in each run, and the results of the mAP, Precision, Recall, and Loss curves are analyzed. Figure 8 illustrates the training flow of YOLOv5.
Figure 8. YOLOv5 training flowchart
2.6.Analysis of results
After the training of each model, analyses of metrics such as Precision (2), Recall (3), F1-score (4), loss rate, and mAP (5) were conducted, the latter being calculated based on Average Precision (6). TP represents the set of true positives, FP false positives, FN false negatives, and N the number of classes. Several studies indicate that metrics such as F1-score and mAP (Mean Average Precision) are appropriate for model comparison [12], [29]. |

|
3. Results and Discussion
Below, the results obtained by each of the four versions of YOLOv5 are presented.
3.1.YOLOv5s
YOLOv5 small achieved better results (mAP = 69.42% and F1-score = 68.23%) when training the model with experiment 5, i.e., with a batch size of 8, 171 epochs, applying transfer learning, and without incorporating data augmentation (See Table 5).
Table 5. YOLOv5 small – Training Results
3.2.YOLOv5m
YOLOv5 medium achieved better results than YOLOv5s (mAP = 81.99% and F1-score = 78.57%) when training the model with experiment 22, i.e., with a batch size of 16, 139 epochs, applying transfer learning, and without incorporating data augmentation (See Table 6). |
Table 6. YOLOv5 medium – Training Results
3.3.YOLOv5l
YOLOv5 large achieved results similar to YOLOv5m (mAP = 81.88% and F1-score = 80.51%) when training the model with experiment 37, i.e., with a batch size of 8, 180 epochs, applying transfer learning, and without incorporating data augmentation (See Table 7).
Table 7. YOLOv5 large – resultados del entrenamiento
3.4.YOLOv5xl
YOLOv5 extra-large achieved slightly lower results than YOLOv5m and YOLOv5l (mAP = 79.25% and F1-score = 76.92%) when training the model with experiment 56, i.e., with a batch size of 32, 178 epochs, applying transfer learning, and without incorporating data augmentation (See Table 8). This was the only case where the best results were achieved with a batch size that was relatively larger compared to the other three algorithms. |


|
Table 8. YOLOv5 extra-large – Training Results
3.5.YOLOv5 – Best results
A ranking of the 64 experiments was generated, considering the Mean Average Precision (mAP) as the classification factor (See Table 9).
Table 9. Details of the conducted experiments
|
The most outstanding results for each algorithm are documented in Table 10 and presented graphically in Figure 9 (mAP), Figure 10 (precision), Figure 11 (recall), Figure 12 (training loss rate) and Figure 13 (validation loss rate). In the four evaluated scenarios, it is observed that the most remarkable performance was achieved by employing transfer learning without incorporating data augmentation. From the 64 experiments conducted, the most outstanding model was developed by employing YOLOv5m and training it for 139 epochs, with a batch size of 8, without incorporating data augmentation and applying the transfer learning technique.
Table 10. Top performances for each algorithm
Figure 9. YOLOv5 – Best results: mAP – Model training |


|
Figure 10. YOLOv5 – Best results: Precision – Model training
Figure 11. YOLOv5 – Best results: Recall – Model training
Figure 12. YOLOv5 – Best results: Loss rate – Model training |
Figure 13. YOLOv5 – Best results: Loss rate – Model validation
Figure 14 illustrates the graphical representation of the proposal derived from this research. The first step in the process is to incorporate the thermographic image database; then, the model is trained using the YOLOv5m algorithm, and finally, hotspots are detected in images of electrical substations. Figure 15 displays various predictions made by the model, along with their respective percentages. These results were obtained using images from the test dataset, which were not previously included in the training and validation phases of the model.
Figure 14. Proposed model |


|
Figure 15. YOLOv5 medium – Hotspot detection
4. Conclusions
The primary aim of this study was to delve into innovative perspectives diverging from conventional artificial intelligence techniques. Special attention was directed towards the YOLOv5 object detection algorithm, acknowledging its remarkable efficiency in training processes. Four iterations of the YOLOv5 algorithm underwent evaluation across 64 experiments, trained with a dataset of thermal images sourced from electrical substations. The findings reveal a discernible trend towards enhanced precision with an escalation in the number of training epochs, coupled with exploring alternative values beyond those employed in this study, encompassing optimizers, hyperparameters, and others. Integrating data augmentation techniques has a negative impact on the precision of the models across all evaluated scenarios. Conversely, the transfer learning strategy, incorporating pre-trained weights for convolutional layers, enhances performance. Regarding the batch size, optimal results were attained within the range of 4 to 32, justified by the inherent size constraints of the current dataset. Nevertheless, it is crucial to note that this parameter may vary in future research involving more extensive datasets of thermographic images. Scaled weight decay and Early stopping techniques were crucial in preventing overfitting. In this context, early termination of training was implemented when there was no improvement in performance over a specific number of epochs. The findings of this research establish a valuable foundation for future investigations exploring the application of similar algorithms in the domain of hotspot detection in the electrical sector. As a recommendation for subsequent studies, it is advised to consider incorporating models with additional variants of the YOLOv5 algorithm, such as YOLOv5n6, YOLOv5s6, YOLOv5m6, YOLOv5l6, YOLOv5x6, or exploring alternative approaches like R-CNN and Faster R-CNN, among others. Based on the outcomes of this study, it could be anticipated that these explorations could result in enhanced performance. Ultimately, exploring the possibility of integrating the developed model into a thermographic camera is highly recommended, thus facilitating real-time alert generation during image capture in the field. |
References
[1] S. Hussain, J. Hernandez Fernandez, A. K. Al-Ali, and A. Shikfa, “Vulnerabilities and countermeasures in electrical substations,” International Journal of Critical Infrastructure Protection, vol. 33, p. 100406, 2021. [Online]. Available: https://doi.org/10.1016/J.IJCIP.2020.100406 [2] Y.-E. Bouffard-Vercelli and B. André, “Future architectures of electrical substations,” in 2021 Petroleum and Chemical Industry Conference Europe (PCIC Europe), 2021. [Online]. Available: https://doi.org/10.23919/PCICEurope50407.2021.9805424 [3] W. Pavon, E. Inga, S. Simani, and M. Nonato, “A review on optimal control for the smart grid electrical substation enhancing transition stability,” Energies, vol. 14, no. 24, 2021. [Online]. Available: https://doi.org/10.3390/en14248451 [4] M. Lin, L. Fu, F. Zeng, G. Yang, and M. Sun, “Design of distributed substation high voltage electrical equipment online monitoring system based on image segmentation technology,” Journal of Physics: Conference Series, vol. 2143, no. 1, p. 012001, dec 2021. [Online]. Available: https://dx.doi.org/10.1088/1742-6596/2143/1/012001 [5] M. A. Haq, D. Kurniawan Danu, Syafii, and Muhardika, “Mitigation of the potential for sudden high-temperature hotspots on substation equipment,” in 2023 4th International Conference on High Voltage Engineering and Power Systems (ICHVEPS), 2023, pp. 194–198. [Online]. Available: https://doi.org/10.1109/ICHVEPS58902.2023.10257349 [6] S. Y. Lee and S. S. Teoh, “A survey on infrared thermography based automatic electrical fault diagnosis techniques,” in 10th International Conference on Robotics, Vision, Signal Processing and Power Applications, M. A. M. Zawawi, S. S. Teoh, N. B. Abdullah, and M. I. S. Mohd Sazali, Eds. Singapore: Springer Singapore, 2019, pp. 537–542. [Online]. Available: https://doi.org/10.1007/978-981-13-6447-1_68 [7] F. Ciampa, P. Mahmoodi, F. Pinto, and M. Meo, “Recent advances in active infrared thermography for non-destructive testing of aerospace components,” Sensors, vol. 18, no. 2, 2018. [Online]. Available: https://doi.org/10.3390/s18020609 [8] M. Haenlein and A. Kaplan, “A brief history of artificial intelligence: On the past, present, and future of artificial intelligence,” California Management Review, vol. 61, no. 4, pp. 5–14, 2019. [Online]. Available: https://doi.org/10.1177/0008125619864925 [9] A. Ghahramani, G. Castro, S. A. Karvigh, and B. Becerik-Gerber, “Towards unsupervised learning of thermal comfort using infrared thermography,” Applied Energy, vol. 211, pp. 41–49, 2018. [Online]. Available: https://doi.org/10.1016/j.apenergy.2017.11.021 [10] Y. J. Wai, Z. bin Mohd Yussof, S. I. bin Salim, and L. K. Chuan, “Fixed point implementation of Tiny-Yolo-v2 using OpenCL on FPGA,” International Journal of Advanced Computer Science and Applications, vol. 9, no. 10, 2018. [Online]. Available: http://dx.doi.org/10.14569/IJACSA.2018.091062 |

|
[11] Y. Xiao, Z. Tian, J. Yu, Y. Zhang, S. Liu, S. Du, and X. Lan, “A review of object detection based on deep learning,” Multimedia Tools and Applications, vol. 79, no. 33, pp.23 729–23 791, Sep 2020. [Online]. Available: https://doi.org/10.1007/s11042-020-08976-6 [12] S. Srivastava, A. V. Divekar, C. Anilkumar, I. Naik, V. Kulkarni, and V. Pattabiraman, “Comparative analysis of deep learning image detection algorithms,” Journal of Big Data, vol. 8, no. 1, p. 66, May 2021. [Online]. Available: https://doi.org/10.1186/s40537-021-00434-w [13] D. Dlužnevskij, P. Stefanovic, and S. Ramanauskaite, “Investigation of yolov5 efficiency in iphone supported systems,” Baltic Journal of Modern Computing, vol. 9, no. 3, pp. 333–344, 2021. [Online]. Available: https://doi.org/10.22364/bjmc.2021.9.3.07 [14] G. Liu, J. C. Nouaze, P. L. Touko Mbouembe, and J. H. Kim, “Yolo-tomato: A robust algorithm for tomato detection based on yolov3,” Sensors, vol. 20, no. 7, 2020. [Online]. Available: https://doi.org/10.3390/s20072145 [15] Z. Ma, Y. Wan, J. Liu, R. An, and L. Wu, “A kind of water surface multi-scale object detection method based on improved yolov5 network,” Mathematics, vol. 11, no. 13, 2023. [Online]. Available: https://doi.org/10.3390/math11132936 [16] X. Gong, Q. Yao, M. Wang, and Y. Lin, “A deep learning approach for oriented electrical equipment detection in thermal images,” IEEE Access, vol. 6, pp. 41 590–41 597, 2018. [Online]. Available: https://doi.org/10.1109/ACCESS.2018.2859048 [17] X. Li, “Design of infrared anomaly detection for power equipment based on yolov3,” in 2019 IEEE 3rd Conference on Energy Internet and Energy System Integration (EI2), 2019, pp. 2291–2294. [Online]. Available: https://doi.org/10.1109/EI247390.2019.9061852 [18] A. Greco, C. Pironti, A. Saggese, M. Vento, and V. Vigilante, “A deep learning based approach for detecting panels in photovoltaic plants,” in Proceedings of the 3rd International Conference on Applications of Intelligent Systems, ser. APPIS 2020. New York, NY, USA: Association for Computing Machinery, 2020. [Online]. Available: https://doi.org/10.1145/3378184.3378185 [19] D. T. Nguyen, T. N. Nguyen, H. Kim, and H.-J. Lee, “A high-throughput and power-efficient FPGA implementation of YOLO CNN for object detection,” IEEE Transactions on Very Large Scale Integration (VLSI) Systems, vol. 27, no. 8, pp. 1861–1873, 2019. [Online]. Available: https://doi.org/10.1109/TVLSI.2019.2905242
|
[20] D. Fan, D. Liu, W. Chi, X. Liu, and Y. Li, “Improved ssd-based multi-scale pedestrian detection algorithm,” in Advances in 3D Image and Graphics Representation, Analysis, Computing and Information Technology, R. Kountchev, S. Patnaik, J. Shi, and M. N. Favorskaya, Eds. Singapore: Springer Singapore, 2020, pp. 109–118. [Online]. Available: https://doi.org/10.1007/978-981-15-3867-4_14 [21] S. Ren, K. He, R. Girshick, and J. Sun, “Faster R-CNN: Towards real-time object detection with region proposal networks,” IEEE Transactions on Pattern Analysis and Machine Intelligence, vol. 39,no. 6, pp. 1137–1149, 2017. [Online]. Available: https://doi.org/10.1109/TPAMI.2016.2577031 [22] W. Chen, H. Huang, S. Peng, C. Zhou, and C. Zhang, “Yolo-face: a real-time face detector,” The Visual Computer, vol. 37, no. 4, pp. 805–813, Apr 2021. [Online]. Available: https://doi.org/10.1007/s00371-020-01831-7 [23] S. A. Sanchez, H. J. Romero, and A. D. Morales, “A review: Comparison of performance metrics of pretrained models for object detection using the tensorflow framework,” IOP Conference Series: Materials Science and Engineering, vol. 844, no. 1, p. 012024, may 2020. [Online]. Available: https://dx.doi.org/10.1088/1757-899X/844/1/012024 [24] J. Xue, F. Cheng, Y. Li, Y. Song, and T. Mao, “Detection of farmland obstacles based on an improved YOLOv5s algorithm by using CIoU and anchor box scale clustering,” Sensors, vol. 22, no. 5, 2022. [Online]. Available: https://doi.org/10.3390/s22051790 [25] A. Li, S. Sun, Z. Zhang, M. Feng, C. Wu, and W. Li, “A multi-scale traffic object detection algorithm for road scenes based on improved YOLOv5,” Electronics, vol. 12, no. 4, 2023. [Online]. Available: https://doi.org/10.3390/electronics12040878 [26] J. Shi, J. Yang, and Y. Zhang, “Research on steel surface defect detection based on YOLOv5 with attention mechanism,” Electronics, vol. 11, no. 22, 2022. [Online]. Available: https://doi.org/10.3390/electronics11223735 [27] D. A. Pérez-Aguilar, R. H. Risco-Ramos, and L. Casaverde-Pacherrez, “Transfer learning en la clasificación binaria de imágenes térmicas,” INGENIUS, no. 26, pp. 71–86, 2021. [Online]. Available: https://doi.org/10.17163/ings.n26.2021.07 [28] A. Yan-Tak Ng. (2022) Unbiggen ai. IEEE Spectrum. IEEE Spectrum. [Online]. Available: https://bit.ly/3RNNvsr [29] R. Padilla, W. L. Passos, T. L. B. Dias, S. L. Netto, and E. A. B. da Silva, “A comparative analysis of object detection metrics with a companion open-source toolkit,” Electronics, vol. 10, no. 3, 2021. [Online]. Available: https://doi.org/10.3390/electronics10030279 |
|
|
|